Business Intelligence
Vueterra can also provide expertise in reviewing your current system and data architecture to identify areas of inefficiency and provide recommendations on how to improve your overall solution design.
Our capabilities span the entire software stack right from Database configuration, through to Data Engineering as well as Data Science.
Our Vueterra on Demand product is designed specifically to deliver out-of-the-box live Business Intelligence reporting dashboards overnight delivering more value without the headache of multiple software packages and long drawn-out projects.
Furthermore, we are a Microsoft partner and as a result, possess the right mix of skills tailored to the Azure ecosystem - an important consideration particularly when determining the correct approach from a database administration and DevOps perspective.
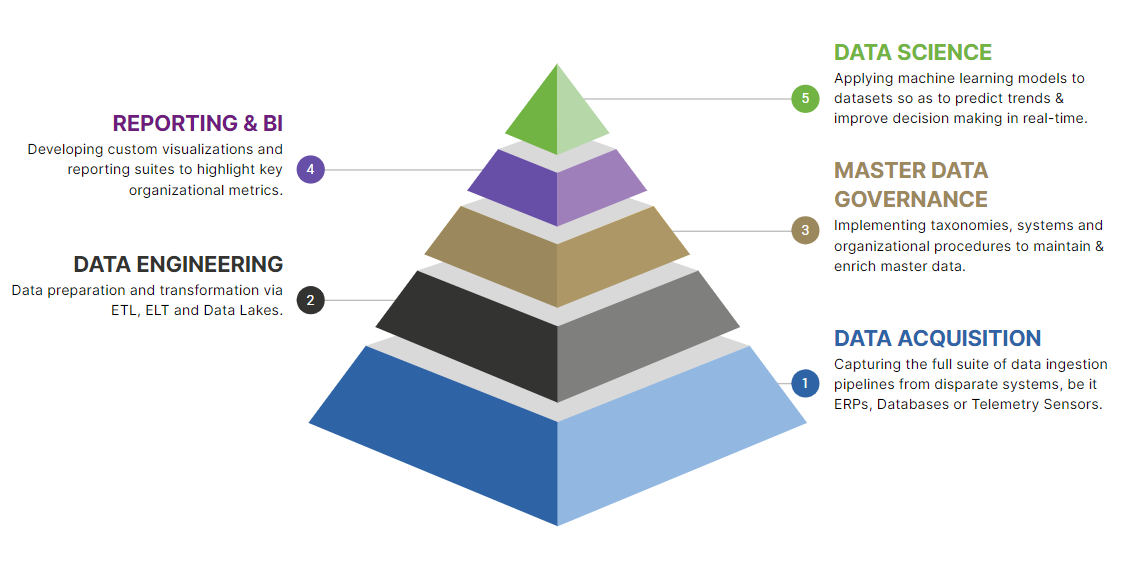
01. DATA ACQUISITION
Understanding source system data and the ability to easily connect to and read data from those systems is critical to the data acquisition process and goes hand in hand with the scoping process outlined in the Systems pillar.
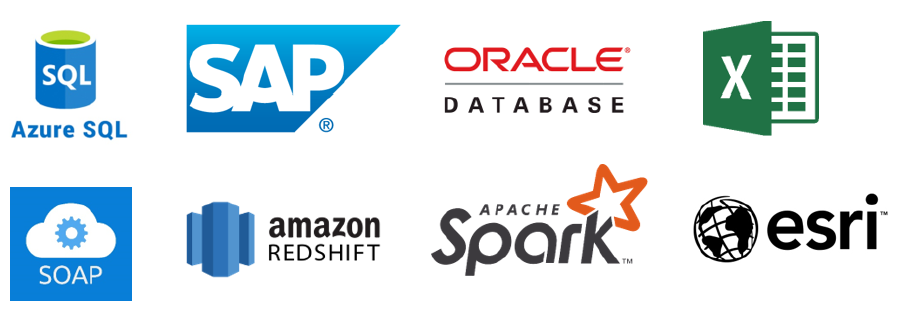
At Vueterra our philosophy is to be "source system agnostic", that is, we work around your technology stack and develop data pipelines around that stack. Where we are not easily able to connect to a data source or don't have pre-defined system connectors we will reach out to the relevant integration partner and seek assistance to build a custom connector. This flexible approach allows us to continue leveraging the strengths of our in-house toolkit to deliver the best possible outcome for the client.
Below are just some examples of the source systems we can ingest data from:
02. DATA ENGINEERING
Vueterra predominantly uses the Alteryx analytics process automation tool to build a series of custom, repeatable workflow processes aimed at collating and transforming data from ERP systems and other disparate data systems to actionable data sets for business users.
This tool is available in the Azure marketplace and is substantially more advanced than Azure Data Factory in that it significantly reduces the lead time, support and costs associated with creating additional tables in SQL Server. Alteryx is being used internally at Vueterra to reduce database creation and maintenance time from weeks to hours.
The scalability of the Alteryx software empowers companies and their employees to accelerate day to day analytics, manage database cleanliness, and visualisation of business-wide data from a single source.
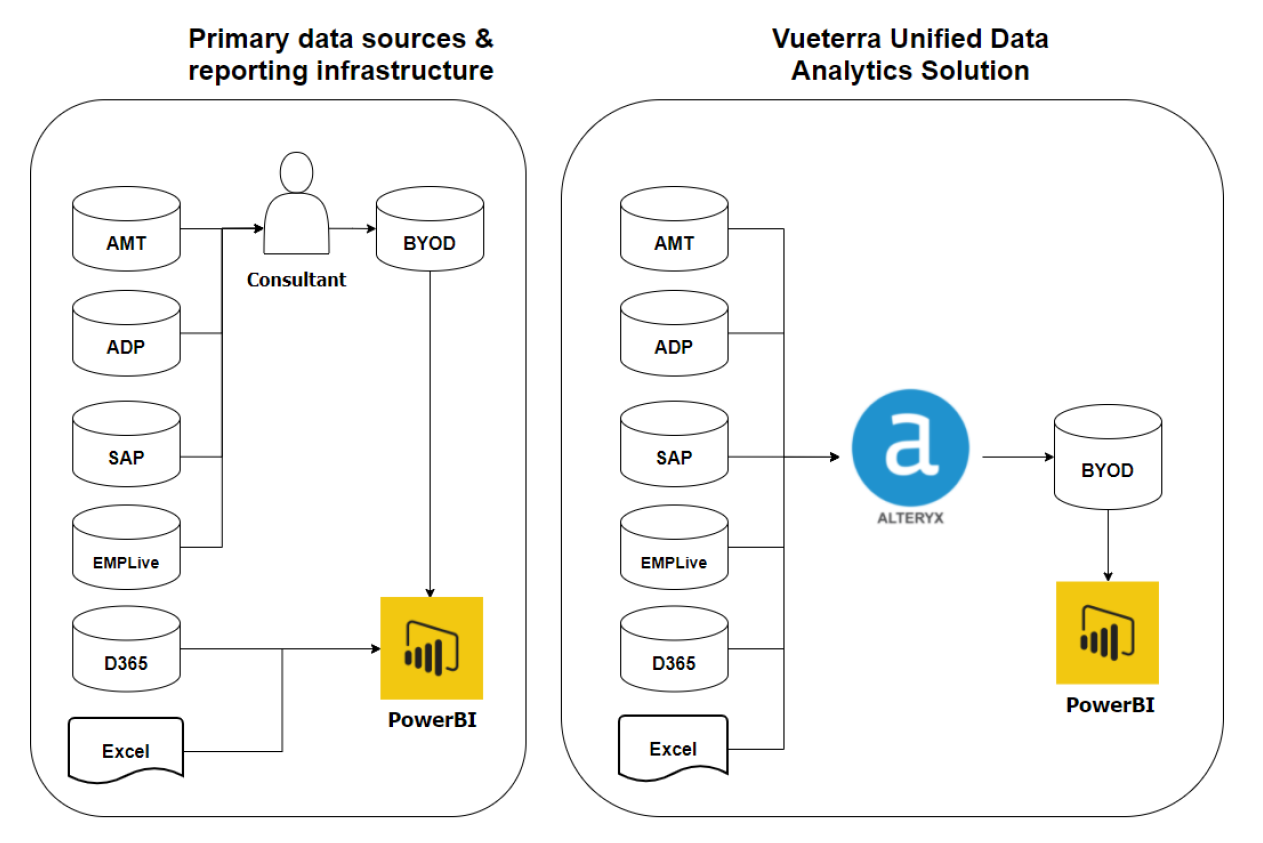
By unifying all data sources Alteryx can create a "single source of truth" database by serving pre-cleansed data in line with a consistent schema from multiple sources - allowing for more efficient dashboard development in PowerBI due to improved data source loading times. The more calculations that can be pushed back into the data warehouses, the faster dashboards can be loaded and refreshed.
This is illustrated by the following diagram where a consultant who would primarily spend hours mashing data in both SQL and Excel between various disparate sources could reduce the time they spend preparing data for visualization by consolidating all data preparation and ETL via Alteryx and serving it into a "Bring Your Own Data" database:
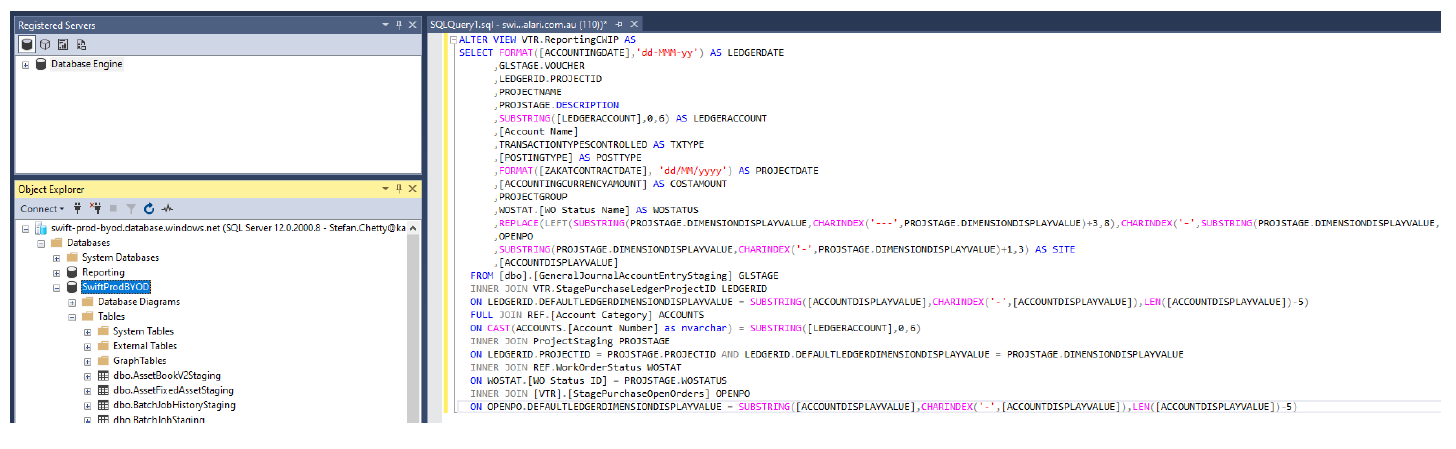
BEFORE - complex SQL code:
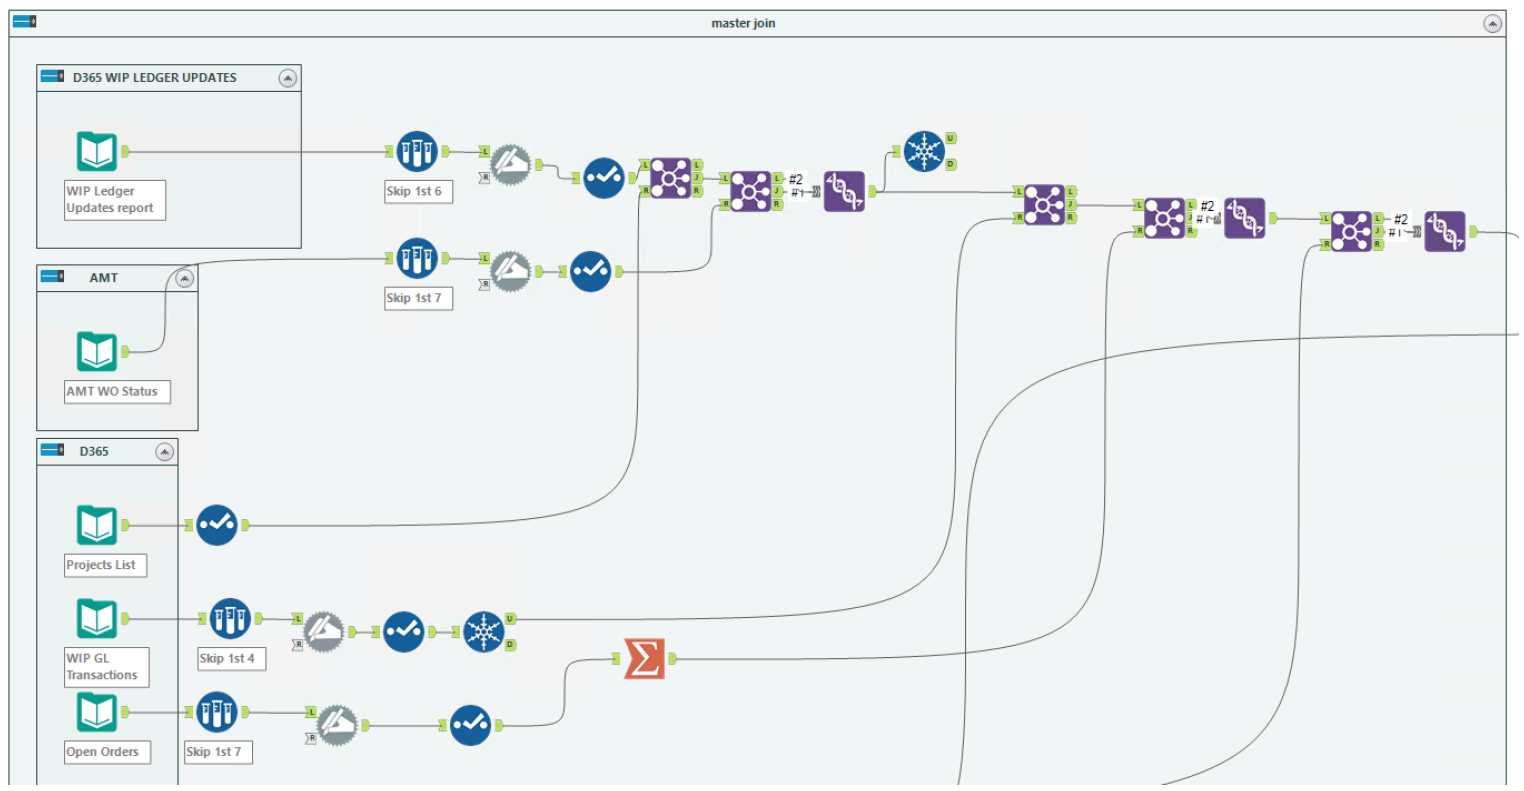
AFTER - intuitive, easy to build and auditable workflows:
03. MASTER DATA GOVERNANCE
Once you've ingested your data, prepared it and stored it in either your database or data lake, how do you go about ensuring it is ready to be used and interpreted by data visualization tools and machine learning models? An extra layer of enrichment and context is required in order to properly glean actionable insights from data and ensure that predictive models are accurate.
This is where the master data layer comes in, the majority of our team started their careers in master data governance - it is the fundamental layer behind both ERP systems and analytic models. Over the years we've had the opportunity to work with a broad range of tools however the main issue we come across is the uptake of the tool within an organization, particularly at a line level.
By combining both our Description Quick Cleanse and our Supply Chain Health Checks, Vueterra can provide you with an in-depth overview of the health of your Master Data not only from a systems perspective but also from your people, processes, tools and documentation. We can enrich a Pareto set of your master data in a fraction of the time whilst also providing you with a set of recommendations for increasing the uptake of your master data governance tools and processes in the longer term.
Below are just some of the tools we have worked with in the past or can offer as part of our suite of services.
04. REPORTING & BI
In-depth reporting and business intelligence are about more than just a few fancy charts and metrics - the main question you need to ask yourself is, are you tracking the correct metrics or are you standing up reporting for the sake of reporting?
Combining our analytics capabilities with our deep functional expertise and experience talking to lean boards, we can speed up the time to delivery of your reporting solutions by developing aesthetically-pleasing dashboards which talk to the most pertinent metrics impacting your operation's efficiency from both a financial and productivity standpoint.
There is by no means a "one-size fits all" solution when it comes to the choice of data visualization tools, some tools are perfect for line-level reporting (e.g. PowerBI), whilst others are more complex and suited to Executive-level reporting (Tableau).
In other cases, you may have customer-facing dashboards which require embedding into websites (SiSense) - we have built with all of these solutions and are willing to recommend the right approach depending on your operation's needs. From a security perspective, all solutions have row-level security access which provides you with the flexibility of controlling who can see what information you decide to serve in each dashboard.
05. DATA SCIENCE
Data Science is the final piece of the puzzle when it comes to your overall analytics strategy and ranges from Descriptive Analytics (what happened in the past) all the way through to Predictive Analytics and Deep Learning - the selection of each of these methods depends on the use case or problem at hand.
For instance, you may simply want to analyze past correlations or trends between two variables (e.g. Truck Hours and Downtime) or you may want to use historical correlations to predict when a piece of equipment might fail in the future. Alternatively, for a more advanced problem, you may wish to use a combination of sensor data, ongoing 3D scans and Deep Learning to identify fundamental design flaws in a piece of equipment that cause it to continuously fail.
At Vueterra we leverage the latest Data Science tools to suit these specific use cases, some of which include the following:

Copyright © 2022Vueterra. All rights reserved.
Solutions
Systems
Supply Chain
Business Intelligence
Company
About us Careers